Welcome to Greg’s Grades. I’m excited about bringing my UVA Football grade report to Augusta Free Press.
Over the next few weeks, I will discuss how this grading system works and some of the lesser-known facets and statistical components that build a more analytical grading system vs. a subjective grading concept.
It has proven to provide a more accurate and consistent way of grading college football, not just game after game, but season after season.
There are three segments to this report:
- Operations Breakdown, where we look at the offense, defense and special teams’ operations’ and offer a short game recap and review their operational grades.
- Second is a look at each individual unit (QB, RB, DB, etc.) and their unit grades.
- Finally, check out the game notes, and we’ll offer some quick takes on the team’s overall performance by unit.
Before we get into the breakdowns: I don’t know if the following statement is 100 percent correct, but I’m guessing it’s been probably two to three decades, if at all, since UVA had three rushing TDs, scored on 83 percent of its red zone attempts, blocked a punt, returned a kickoff 100 yards for a TD, held the opponent to seven points and did not have a turnover, in a single game.
Operations Breakdown
Offense Game Recap & Game Grade: 88.31 (B+)
The QB unit led the offense with a total grade of 91.29, followed closely by the receivers and ends, who garnered a 91.19.
Passing operations paced the offense with a 90.3 mark while the run game recorded an 83.005.
The QB position took honors for the highest run grade at 93.68.
UVA’s receivers posted a grade of 97.63 for the passing operation, and that operation ended the day with a 90.3 overall.
The biggest takeaway for me from the offense was the cohesiveness of the offensive line. The coaching staff did frequent wholesale as well as segmented substitutions, and the line generally maintained its cohesion.
Speaking with lineman Drake Metcalf after the game, he noted it comes from a bonding process of spending time with fellow linemen outside of football.
“It’s something that [consultant] Scott Pioli talked about,” Metcalf said.
When Metcalf asked Pioli what was something he thought the offensive line could improve, the former NFL executive and multiple Super Bowl title winner offered that “I think you work well with this guy, you have a good relationship with him off-the-field, how about adding some other players, hang out with them more, and you’ll see more benefits on the football field.”
Metcalf affirmed that the more he increased his time with additional players, “the cohesion keeps building more and more.”
Metcalf says that bonding outside of football is a key part of it.
Defense Game Recap & Game Grade: 95.47 (A)
The linebackers finished the game with the top unit grade with a 96.69.
The pass defense operation was stellar, coming in with a 98.21 final mark.
The defensive backs led the operation with a 99.35 grade.
In the run operations, linebackers led the way with a 98.83 tally.
Combining both the passing and rushing operations grades, the defensive line was not left out of the honors having the highest combined operations grade of the three units at 99.12.
Two major differences I noted in Saturday’s game on the defensive side were speed and tackling. The speed increase was easily recognizable on the offense but also with the defense.
The biggest difference in the game for me, however, clearly was the tackling.
Ethan Minter explained: “we don’t want to miss tackles ever, but we really emphasized squeezing on our tackles and going down a level and we really put into practice what we’ve been practicing during camp. That was good to see.”
Yes, it is.
Special Teams Recap & Game Grade: 86.85 (B)
A solid start across most of the special teams’ operations.
Punt coverage led the way with a 97.41, tailed by the kickoff return operation with a 96.64.
Four of five operations posted grades above 81, and three operations delivered championship level grades (A’s).
Punt return had some Game 1 struggles, but will obviously use the week to take corrective action
With that, let’s take a look at the grades and notes.
Week 1 Grades & Notes
Offense – Grades: 88.31 (B+)
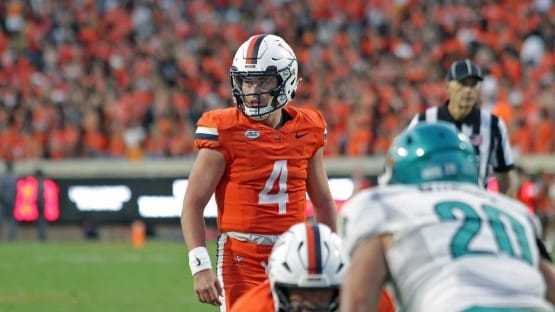
- Quarterback: 91.29 (A-)
- Running backs 82.16 (B-)
- Wide receivers & tight ends: 91.19 (A-)
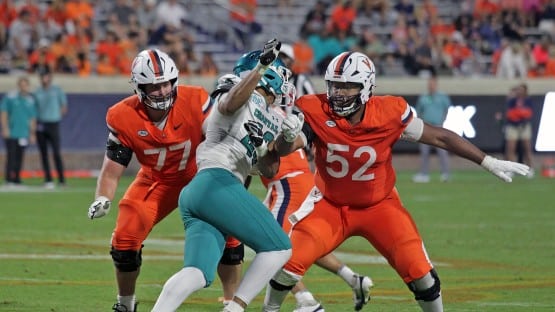
- Offensive line: 88.61 (B+)
Offense – Quick Takes & Notes
Highlights: After ending the 2024 season, placing 92nd in the country in turnover margin, a zero in that stat category is a highlight.
Not so bright: Pittsburgh Steelers head coach Mike Tomlin loathes what he calls “no talent plays.” I understand penalties happen, but athletes at the University of Virginia should know how to count. Be it Game 1 of the season or Game 12, false start penalties should not happen. Nor should illegal formation penalties.
Notes & Stats
- Chandler Morris completed just 20 percent of his first five passing attempts (1-of-5). Over the next 2 ½ quarters he connected on 18 of 22 attempts (81.8 percent) with two touchdowns and zero interceptions.
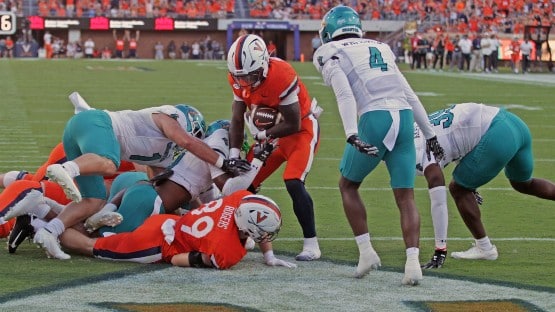
- The Cavaliers offense recorded three rushing touchdowns in a game for the first time since 2022, posting three scores against Richmond and four against North Carolina that season.
- Virginia produced over 450 yards of total offense for the first time in nine games.
- It’s early, but Virginia is ranked No.1 in fewest sacks allowed (0), 19th in scoring offense, 19th in fewest TFL allowed and No.25 in passing offense.
Finishing drives
A key metric I use in my grading is Points Scored Inside the Plus 40-yard line. This is based on the Five Factors that were devised by Bill Connelly of SBNation around 2013.
Connelly’s analysis showed that when winning the “finishing drives battle,” teams won 74.65 percent of the time. Teams that averaged a field goal per trip (3 points) only win 21 percent of the time. The per trip chart and winning percentage are below.
Pts Per Trip Winning %
5.5 to 7 points 72.8%
5 to 5.5 points 68.4%
4.5 to 5 points 62.6%
4 to 4.5 points 51.8%
3.5 to 4 points 50.4%
3 to 3.5 points 38.5% (UVA 2024)
2 to 3 points 23.1%
1 to 2 points 4.9%
0 to 1 points 0.0%
In Saturday’s game the ‘Hoos scored 41 points in nine trips inside the CCU’s 40-yard line. That’s an average of 4.55 points inside the 40 and equates to a 62.6% winning percentage. Last season, UVA rarely rose above the 3.0 to 3.5 level. Coincidently, the Cavaliers win total last season, was 41.6 percent.
Defense – Grades: 95.47 (A)
- Defensive line: 94.45 (A)
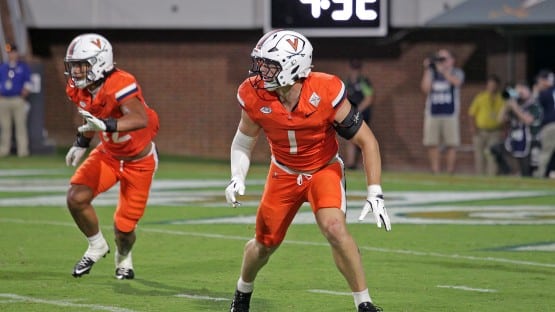
- Linebackers: 96.69 (A)
- Secondary: 95.27 (A)
Defense – Quick Takes & Notes
Highlights: Lots of Havoc plays in Game 1. I charted the following: 6 QB pressures, 10 PBUs, one INT, 2 fumble recoveries, 6 tackles for loss, 5 run stuffs and a sack.
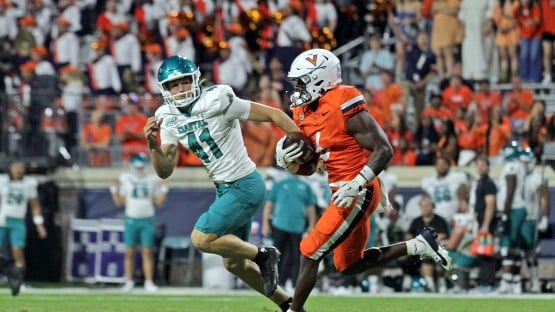
Not so bright: The only thing I can think of that was not very bright defensively was the illegal block called on Ja’son Prevard after the Ethan Minters INT.
Notes & Stats
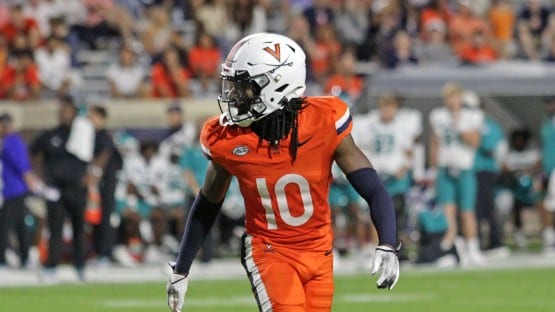
-

UVA Football cornerback Ja’Son Prevard. Photo: Mike Ingalls/AFP The lone TD the UVA defense allowed Saturday was the lowest point total allowed by a Wahoo defense since a 48-0 thumping of Duke in 2021.
- First time holding an opponent scoreless in first half since the same 2021 Duke game.
- CCU converted only one first down in 14 third down attempts. That’s the lowest since Notre Dame converted a single third down in the 2024 game, going 1-for-12 (8.33 percent). The visitors’ 7.1 percent is the lowest percentage since the 2015 game in which Notre Dame failed to convert any third downs.
- In 2024 the UVA defense posted 37 pass breakups (PBUs) in 12 games (3.08/game). With their 10 PBUs against the Chanticleers, the Wahoo defense is already at 25 percent of that season total after only Game 1.
- The 163 yards passing is the fewest a Cavalier defense has allowed since the 10/29/22 Miami game, where Virginia limited the Canes to 125 passing yards.
- With their 10 PBUs and one INT, the Hoos are tied for fifth nationally in passes defended.
Special Teams – Grades: 86.85 (B)
- Kickoff return: 96.64 (A)
- Kickoff coverage: 81.45 (B-)
- Place kicking: 95.37 (A)
- Punt return: 63.38 (D)
- Punt coverage: 97.41 (A)
Special Teams – Quick Takes & Notes
Highlights: It has to be UVA Football getting two huge special teams plays in one game. The kickoff return for TD and the blocked punt were exhilarating.
Not so bright: Punt returns – In 2024 the Wahoo’s finished 89th in the NCAA in punt return average. They averaged 6.32 yards per return a season ago and opened 2025 with a small improvement to 7.75.
Notes & Stats
- Punting – two of UVA punts were placed inside the 20 and covered a distance 50+ yards.
- Last time UVA blocked a punt was at Pitt in 2019. Noah Taylor took the honors.
- It was back in 2019 against Duke that Joe Reed returned a kickoff 95 yards for a TD.
Support AFP