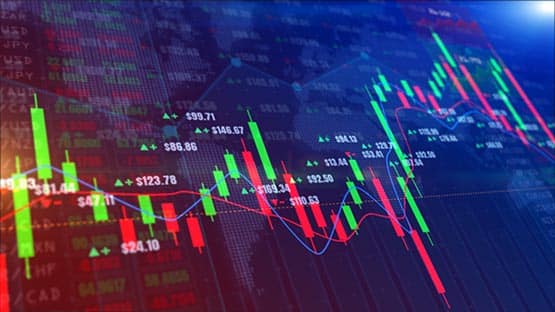
Price charts can describe the same market in different ways, and the choice of display changes what stands out first. A line chart usually connects one selected price from each interval, often the close. A candlestick chart keeps four values for every interval: the open, high, low, and close.
That difference matters because price can travel far inside one period and still finish near where it began. A close-to-close line may make two sessions look similar even when one was quiet and the other moved sharply before returning. Candles retain more of that intraperiod range, although they still summarize rather than replay every move.
For readers building that foundation, an explanation of what a candlestick chart is — showing how OHLC values, candle bodies, wicks, colors, and timeframes fit together — comes before comparing it with simpler displays. The useful next step is to ask what each format preserves and what it leaves out.
The core difference is the amount of price information
A standard line chart commonly uses one data point per interval. TradingView, for example, uses the closing price by default, although other sources such as the open, high, or low can be selected. Connecting those points creates a cleaner visual path that makes broad direction easy to see.
This is a convention rather than a universal rule. Some platforms let users build lines from the open, high, low, or an average price. The comparison still holds: the line normally selects one value per interval, while a standard candle displays all four OHLC values together.
A candlestick uses four data points from the same interval. The body shows the relationship between open and close, while the upper and lower wicks extend to the period high and low. As a result, the trader sees both the ending direction and the range traveled before the interval finished.
| Question | Can a line chart show it? | Can a candlestick chart show it? |
| Where did the period close? | Yes | Yes |
| Where did it open? | Usually not | Yes |
| What was the period high? | Usually not | Yes |
| What was the period low? | Usually not | Yes |
| How wide was the full range? | Not directly | Yes |
| Was the close above or below the open? | Not directly | Yes |
| Is the broad trend easy to scan? | Very clear | Clear but more detailed |
The same closing price can hide very different sessions
Consider two daily periods that both close at 100. In the first, price opens at 99, trades between 98.5 and 100.5, and finishes at 100. In the second, price opens at 100, falls to 94, rallies to 106, and returns to 100 by the close.
A close-only line gives both periods the same ending point. Candles show that the second session had a much wider range and a very different relationship between its extremes and its close.
That extra information can help answer questions such as:
- Was the period relatively narrow or unusually wide?
- Did price close near the high, near the low, or near the middle?
- Was there a large difference between the opening and closing price?
- Did price travel far beyond the candle body before returning?
Candles still compress the price path
More information does not mean complete information. A candle with an open of 100, high of 105, low of 96, and close of 103 does not reveal whether price reached 105 before 96 or the other way around. It also does not show how long price stayed near either extreme.
That is why pattern references such as a candlestick patterns PDF sheet are most useful after OHLC structure is understood. Named formations summarize relationships among prices, but their interpretation still depends on trend, timeframe, surrounding levels, and the price action that follows.
Different markets make the contrast easier to see
The distinction between line and candle charts applies across forex, commodities, indices, stocks, and crypto. What changes is the market structure around the price series.
Forex
In forex, a trader may use a line chart to scan the broader direction of EUR USD while switching to candles to inspect the range of each hourly or daily interval. Because spot forex is an over-the-counter market, quoted highs and lows can vary slightly between data feeds, but the charting principle is the same.
Commodities
In commodities, a gold chart can make the contrast visible during volatile sessions. Two days may close near the same level even though one stayed in a narrow range and the other moved widely. The line emphasizes the closes; candles preserve the larger high-to-low excursion.
Equity indices
For equity indices, a close-only line can make medium-term direction easy to compare. Candles add the opening level and intraday extremes, which matter when a session begins away from the prior close or moves sharply.
Stocks
Stocks add another example because exchange sessions create distinct opens and closes. A line chart displays daily closing prices cleanly, while candles show where a stock opened and how far it traded during the session. Gaps are therefore easier to see directly with OHLC data.
Cryptocurrencies
Crypto trades around the clock on many venues, so the meaning of a daily candle depends on the chart provider’s time boundary. Even so, the comparison remains the same: a line can emphasize the sequence of selected closing values, while candles retain the open, high, low, and close for each chosen interval.
Across these markets, the chart should match the question:
- Use a line when the main goal is to scan direction or compare several assets cleanly.
- Use candles when intraperiod range, opening price, or closing position within the range matters.
- Keep the timeframe consistent when comparing how two markets behaved.
- Check the data source when small differences in OHLC values matter to the analysis.
Visual simplicity can be an analytical advantage
More detail is useful only when it helps answer the question. A chart packed with candles, indicators, drawings, and labels can make a simple trend harder to see. A line chart removes much of that detail and can make turning points or long-term direction easier to scan.
This is a broader data-visualization principle. Choosing the right visual representation depends on the information being examined and the message the display needs to communicate. The same logic applies to market charts: additional data is valuable when it supports the analysis, not simply because more can be shown.
For example, an investor comparing the five-year performance of several stock indices may prefer line charts because four or five candlestick series on the same screen would create clutter. A trader studying the behavior of one index around a specific session may prefer candles because the high, low, and opening price now matter.
The decision can be reduced to three questions:
- Do I need the full OHLC range or mainly the closing path?
- Am I studying one market in detail or comparing several series?
- Does the extra candle information change the decision I am trying to make?
If the answer to the first question is no, the line may be sufficient. If range, opening level, wicks, or individual price bars matter, the candlestick chart carries more useful information.
The timeframe changes both displays
A chart type and a timeframe solve different problems. Moving from a daily line to an hourly line adds more closing observations. Moving from daily candles to hourly candles creates more OHLC summaries. Neither change simply magnifies the existing chart.
On a five-minute candlestick chart, every candle records that five-minute interval. On an hourly chart, the open comes from the beginning of the hour, the close from its end, and the high and low summarize the extremes reached during the full period. The larger candle therefore hides the sequence visible in the smaller bars.
A line chart performs its own compression. If it is based on closes, an hourly line connects hourly closes and leaves the highs, lows, and opens out of the visible series. A daily close-only line removes still more intraday detail.
This is why traders can move between chart types without treating them as competing systems. A line chart can establish the broad directional picture first, then candles can be used to inspect the periods where range or intraday structure deserves closer attention.
Read the chart according to the question
The cleanest way to choose between lines and candles is to start with the analytical task. If the question is whether a stock index has generally risen or fallen over six months, a line can answer quickly. If the question is how price behaved during a volatile session, OHLC candles provide more evidence.
The same principle applies across forex, commodities, stocks, indices, and crypto. Market structure changes, but the visual tradeoff remains consistent: lines simplify the series, while candles preserve more information about each interval.
Neither chart replaces context, and neither predicts the next move by itself. They are different ways to summarize the same underlying price process. Choosing the view that matches the question makes analysis clearer.
This content is provided for informational purposes only and is not a substitute for professional advice. AFP editorial staff were not involved in the creation of this content.
Support AFP



 Share